Bitcoin RHODL Has Been Losing Momentum Recently
An on-chain analyst has pointed out that the Realized HODL (RHODL) Ratio indicator is on the way down, a sign that may not be positive for Bitcoin. The RHODL Ratio is an on-chain metric that calculates the ratio between any two given RHODL wave bands.
Understanding RHODL Wave Bands
HODL wave bands keep track of the percentage of the total BTC supply that was last moved inside a given age range. The RHODL wave bands are a modified form of these, adding an additional weighting factor: the Realized Value. The Realized Value is the spot price at which a given token of the cryptocurrency was last transacted on the blockchain.
What Does the RHODL Ratio Indicate?
The RHODL wave band multiplies this metric with the amount of supply present within a given band, telling us about the sum of cost bases of coins in that band. When the value of the indicator goes up for any particular band, it means the amount of capital invested in coins falling in the age range is rising.
Bitcoin RHODL Ratio Trend
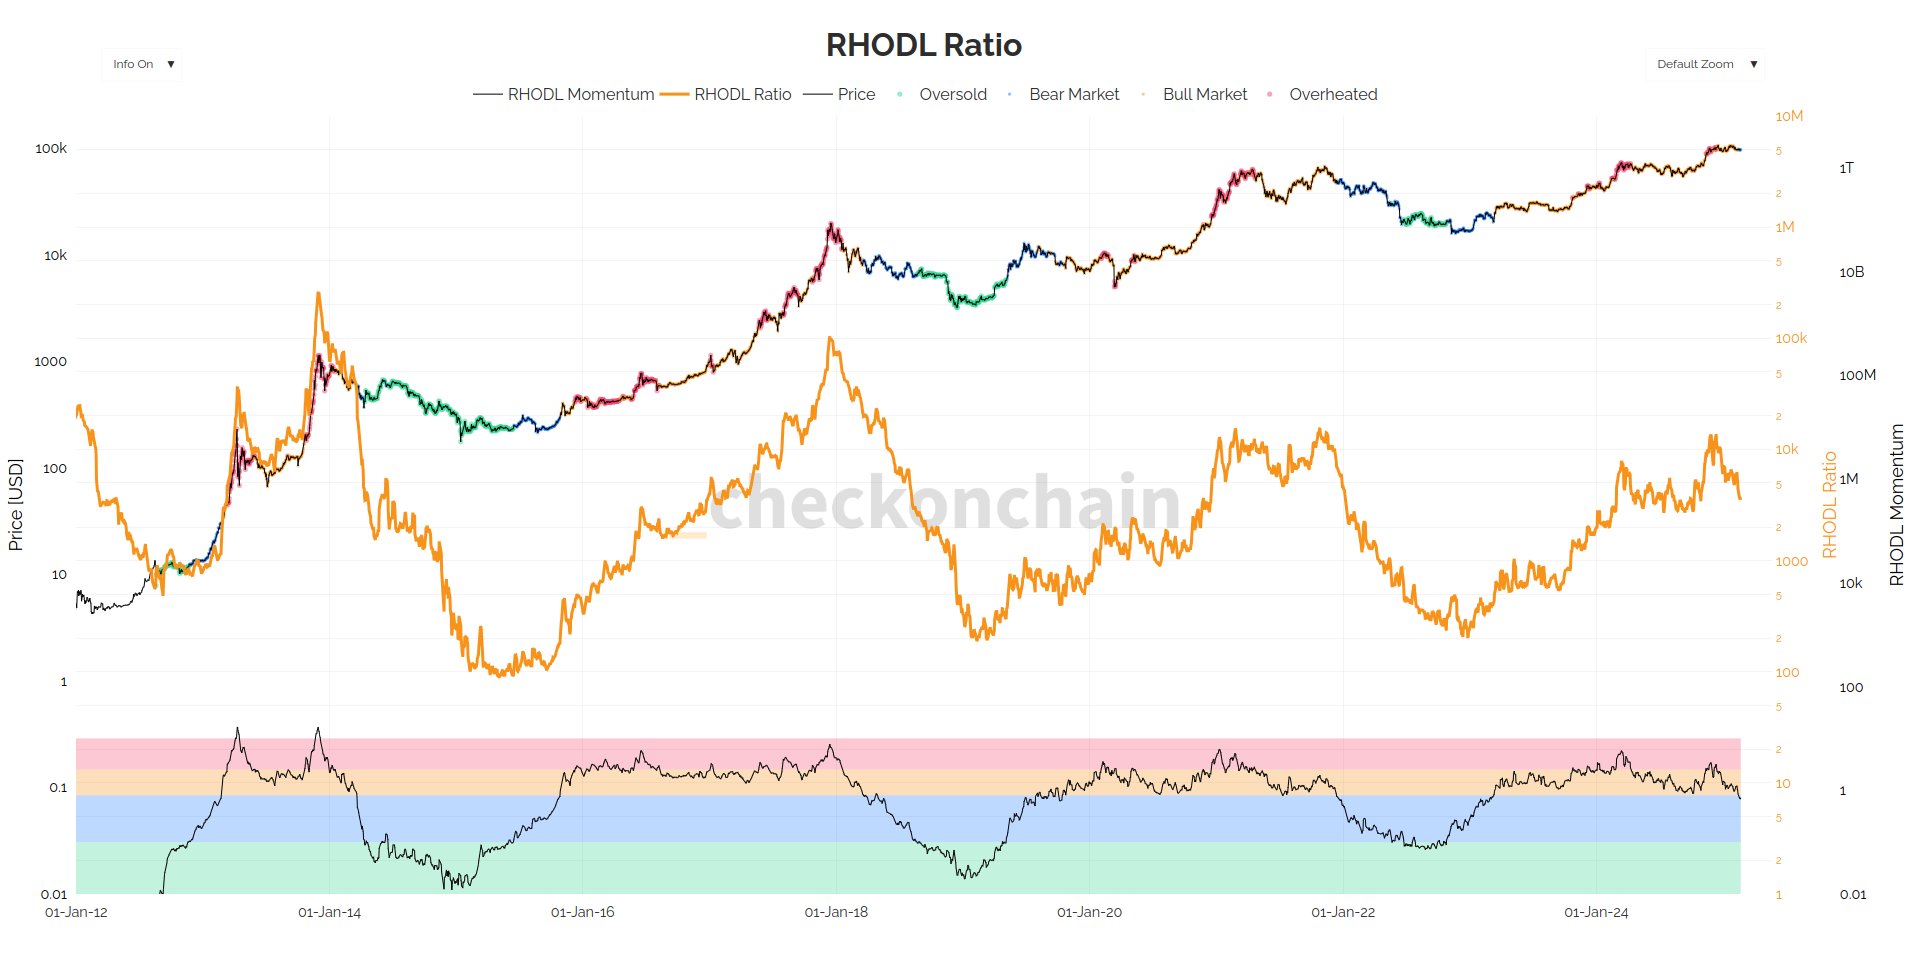
The RHODL Ratio of the 1 week and 1 to 2 years bands is of relevance. As displayed in the above graph, the Bitcoin RHODL Ratio for these wave bands shot up to a high level during the rally beyond $100,000 that took place last year. This trend implies the 1 week wave band, which corresponds to the fresh capital coming into the sector, grew large relative to the veteran 1 year to 2 years band.
Historical Pattern
An extreme rotation of capital into the 1 week wave band has historically coincided with bull run tops for the cryptocurrency’s price. Since last year’s peak, the metric has been on the way down, which suggests the new demand for the asset is now slowing down.
Current Market Situation
Bitcoin made a retest of the $98,000 mark earlier today, but it appears the coin ended up finding rejection as its price is now down to $97,000.
Conclusion
The decline of the RHODL Ratio is a sign that may not be positive for Bitcoin, as it suggests a slowing down of new demand for the asset. The current trend in the RHODL Ratio will be closely watched to see if it will continue its decline, potentially signaling a transition away from a bull market.
FAQs
* What is the Realized HODL (RHODL) Ratio?
The RHODL Ratio is an on-chain metric that calculates the ratio between any two given RHODL wave bands.
* What is the purpose of the RHODL Ratio?
The RHODL Ratio tells us about the sum of cost bases of coins in a given band and the amount of capital invested in coins falling in that age range.
* What is the significance of the 1 week and 1 to 2 years bands in the RHODL Ratio?
The 1 week and 1 to 2 years bands are of relevance because they represent fresh capital coming into the sector and veteran capital, respectively.